1
2
3
4
5
6
7
8
9
10
11
12
13
14
15
16
17
18
19
20
21
22
23
24
25
26
27
28
29
30
31
32
33
34
35
36
37
38
39
40
41
42
43
44
45
46
47
48
49
50
51
52
53
54
55
56
57
58
59
60
61
62
63
64
65
66
67
68
69
70
71
72
73
74
75
76
77
78
79
80
81
82
83
84
85
86
87
88
89
90
91
92
93
94
95
96
97
98
99
100
101
102
103
104
105
106
107
108
109
110
111
112
113
114
115
| import xgboost
import shap
import pickle
import os
import numpy as np
import matplotlib.pyplot as plt
import matplotlib as mpl
mpl.rcParams['font.family'] = ['SimHei']
mpl.rcParams['axes.unicode_minus'] = False
saved_file = '/tmp/adult.pkl'
def dump_info(data):
pickle.dump(data, open(saved_file, "wb"))
print("保存成功")
def load_info():
data = pickle.load(open(saved_file, "rb"))
print("加载成功")
return data
if os.path.exists(saved_file):
X,y = load_info()
else:
X,y = shap.datasets.adult()
dump_info(data=(X,y))
model = xgboost.XGBClassifier().fit(X, y)
explainer = shap.Explainer(model, X)
shap_values = explainer(X)
def find_closely_sublist(src_list, percent=0.05, des_num=0.3):
"""
找出src_list 中与des_num最接近的数字,找到总数量的为百分之percent
:param src_list:
:type src_list: list
:param percent:
:type percent:
:param des_num:
:type des_num:
:return: 返回百分之percent的数据的个数的列表,列表是src_list的子列表
:rtype:
"""
total_num = len(src_list)
got_num = int(total_num * percent)
left_num = right_num = int(got_num/2)
sorted_l = sorted(src_list)
min_closest_idx = 0
min_closed_distance = 100000
for idx, i in enumerate(sorted_l):
if abs(i - des_num) < min_closed_distance:
min_closed_distance = abs(i - des_num)
min_closest_idx = idx
print(f"最接近于{des_num}的数字是{sorted_l[min_closest_idx]}")
start_idx = min_closest_idx - left_num
if start_idx < 0:
start_idx = 0
end_idx = min_closest_idx + right_num
sublist = sorted_l[start_idx:end_idx]
print(f"收集接近于目标值{des_num}, 总数据条数:{total_num}, 收集占比为{percent},共收集到数据条数: {len(sublist)}条,分别是: {sublist}")
return sublist
def get_middle_data(mean_shape):
"""
根据给定的shap,获取shap值为0时,原始data的值,因为有的值不是单递增的,还要判断是否是单调递增的, 统计的方法判断
根据均值和中位数,判断是否是单调递增的,大部分不是线性递增的
:param mean_shape:
:type mean_shape:
:return:
:rtype:
"""
feature_name = mean_shape.feature_names
shape_value = mean_shape.values
feature_data = mean_shape.data
sort_shap = np.sort(shape_value)
sort_shap = sort_shap.tolist()
sublist = find_closely_sublist(src_list=sort_shap,percent=0.05, des_num=0)
start_threhold, end_threhold = min(sublist), max(sublist)
zero_range_shap_idx = np.where((shape_value >= start_threhold) & (shape_value <= end_threhold))
zero_range_data = feature_data[zero_range_shap_idx]
zero_data_mean = np.mean(zero_range_data)
zero_data_median = np.median(zero_range_data)
less_zero_shap_idx = np.where(shape_value < start_threhold)
biger_zero_shap_idx = np.where(shape_value > end_threhold)
less_zero_data = feature_data[less_zero_shap_idx]
biger_zero_data = feature_data[biger_zero_shap_idx]
less_zero_mean = np.mean(less_zero_data)
less_zero_median = np.median(less_zero_data)
biger_zero_mean = np.mean(biger_zero_data)
biger_zero_median = np.median(biger_zero_data)
if less_zero_mean < zero_data_mean < biger_zero_mean and less_zero_median < zero_data_median < biger_zero_median:
return True, zero_data_mean, feature_name
else:
return False, 0, feature_name
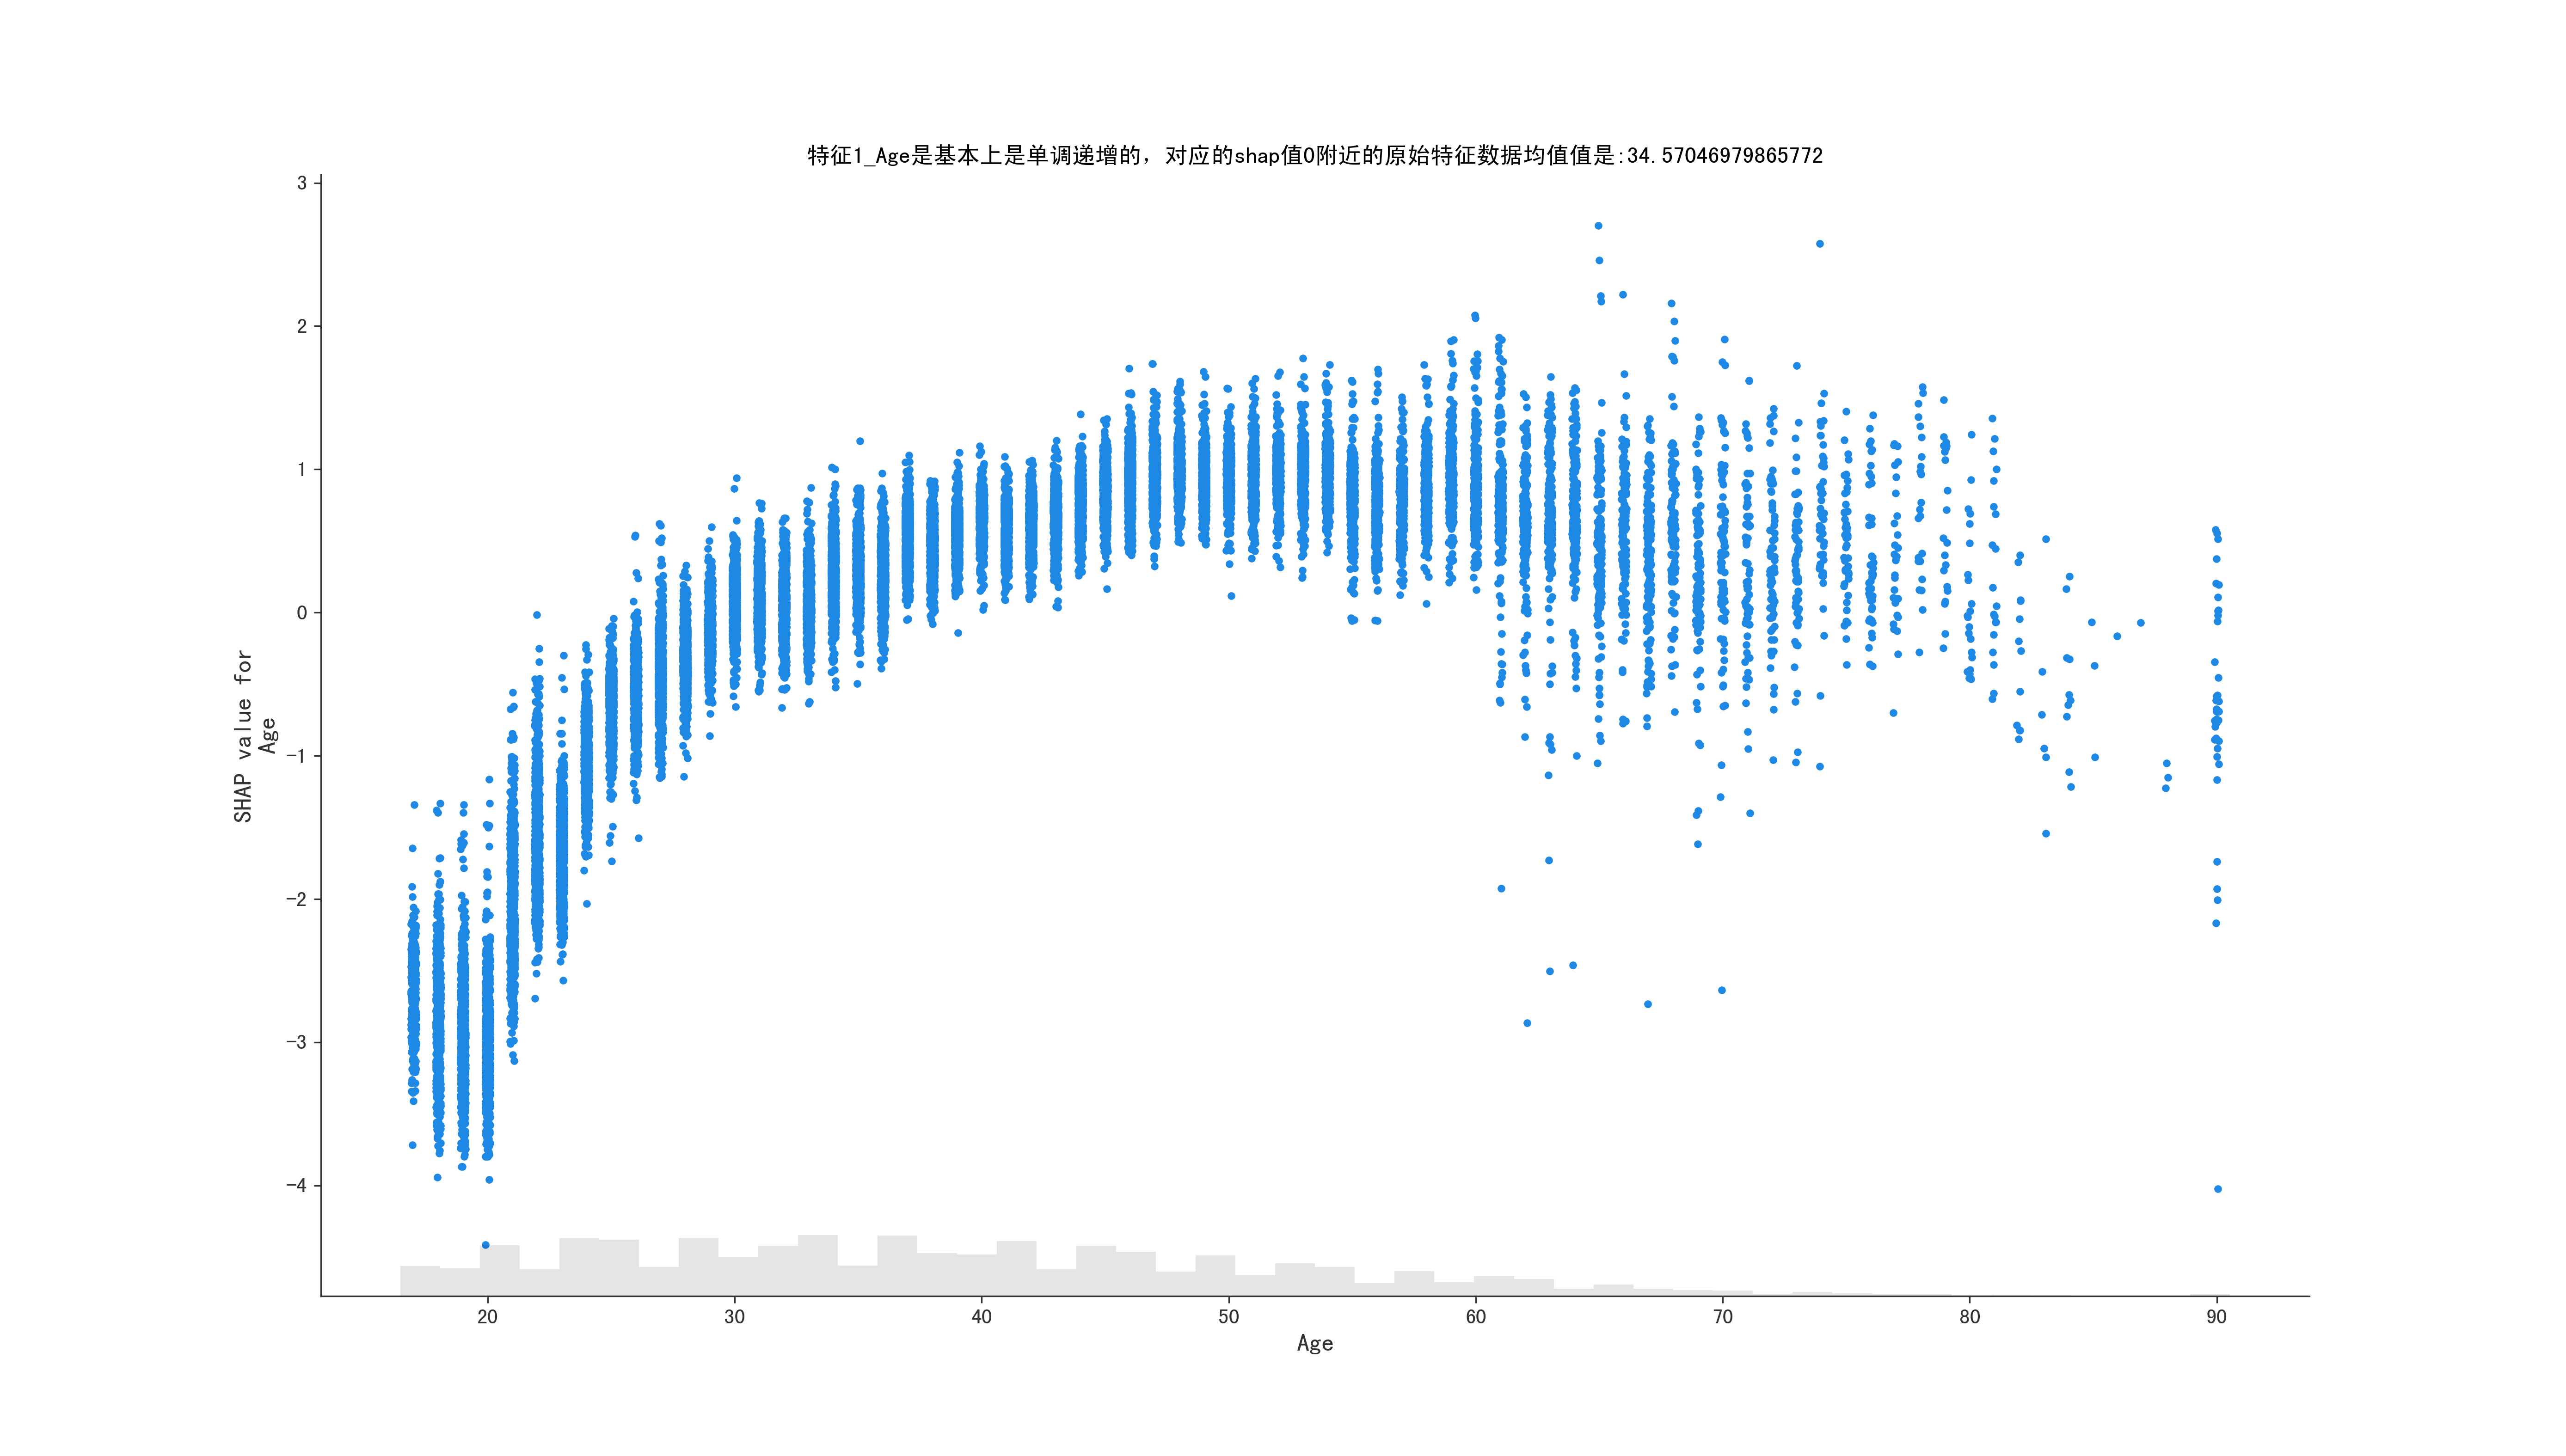
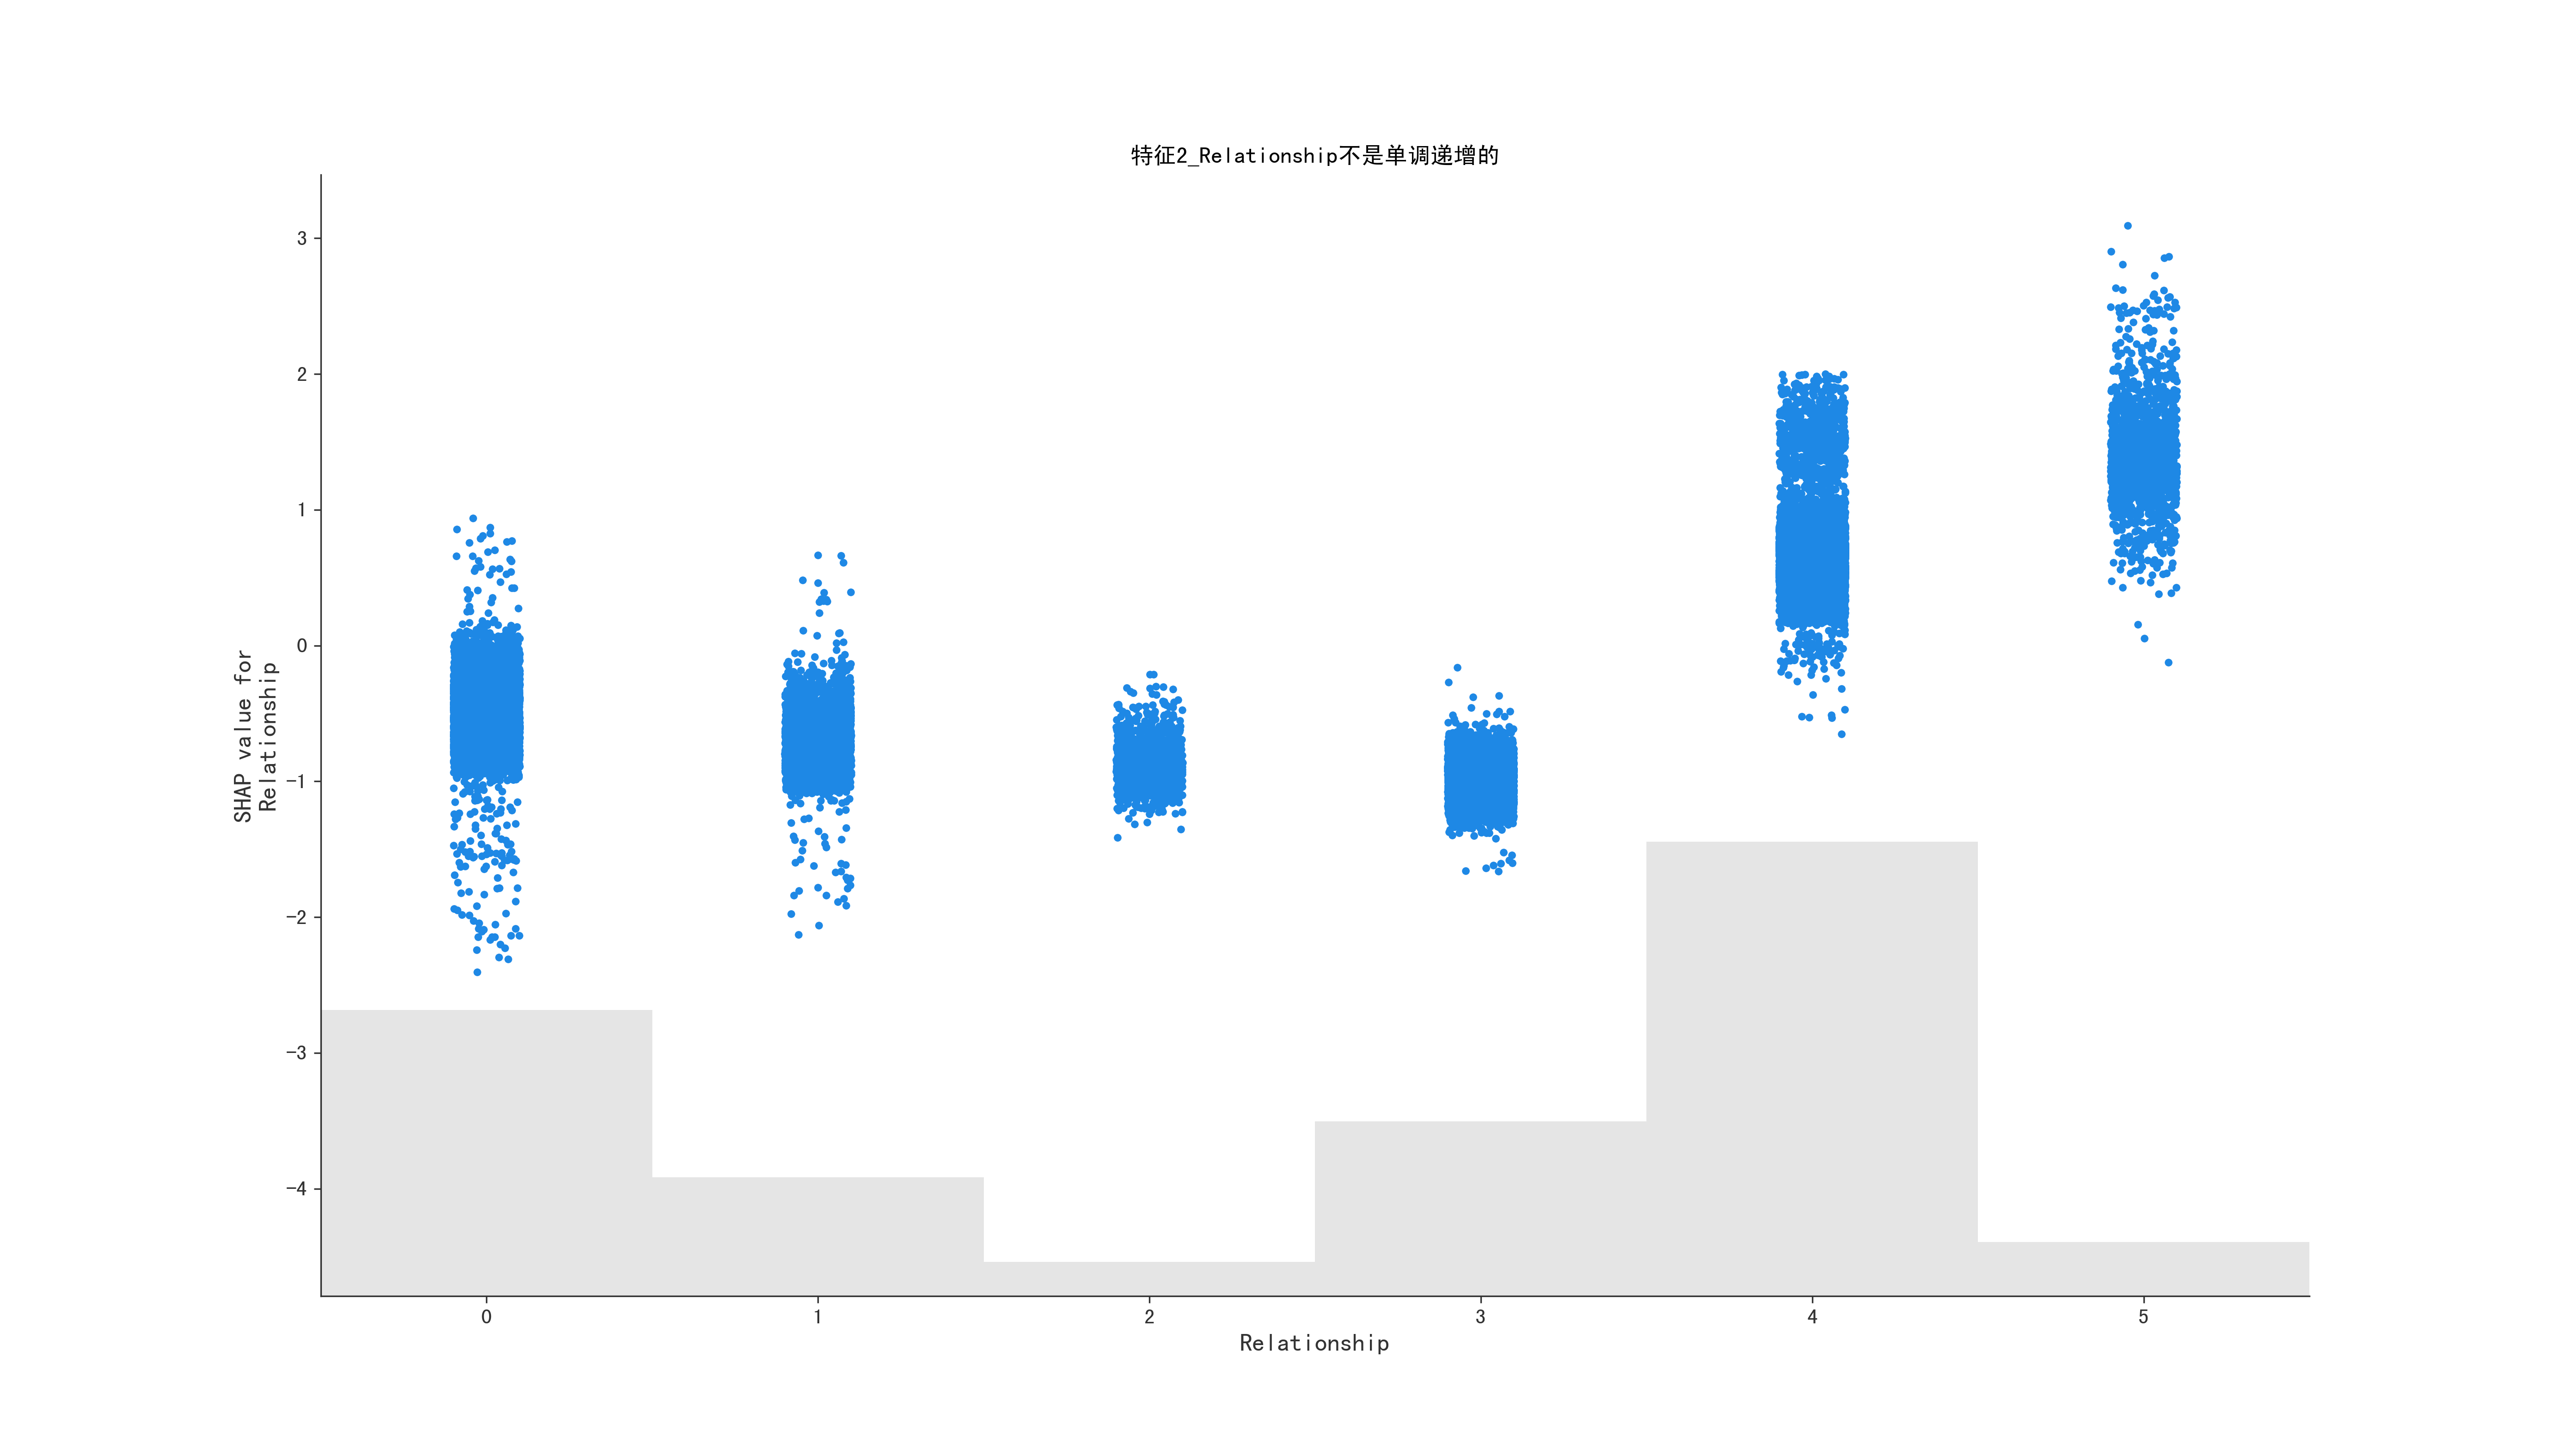
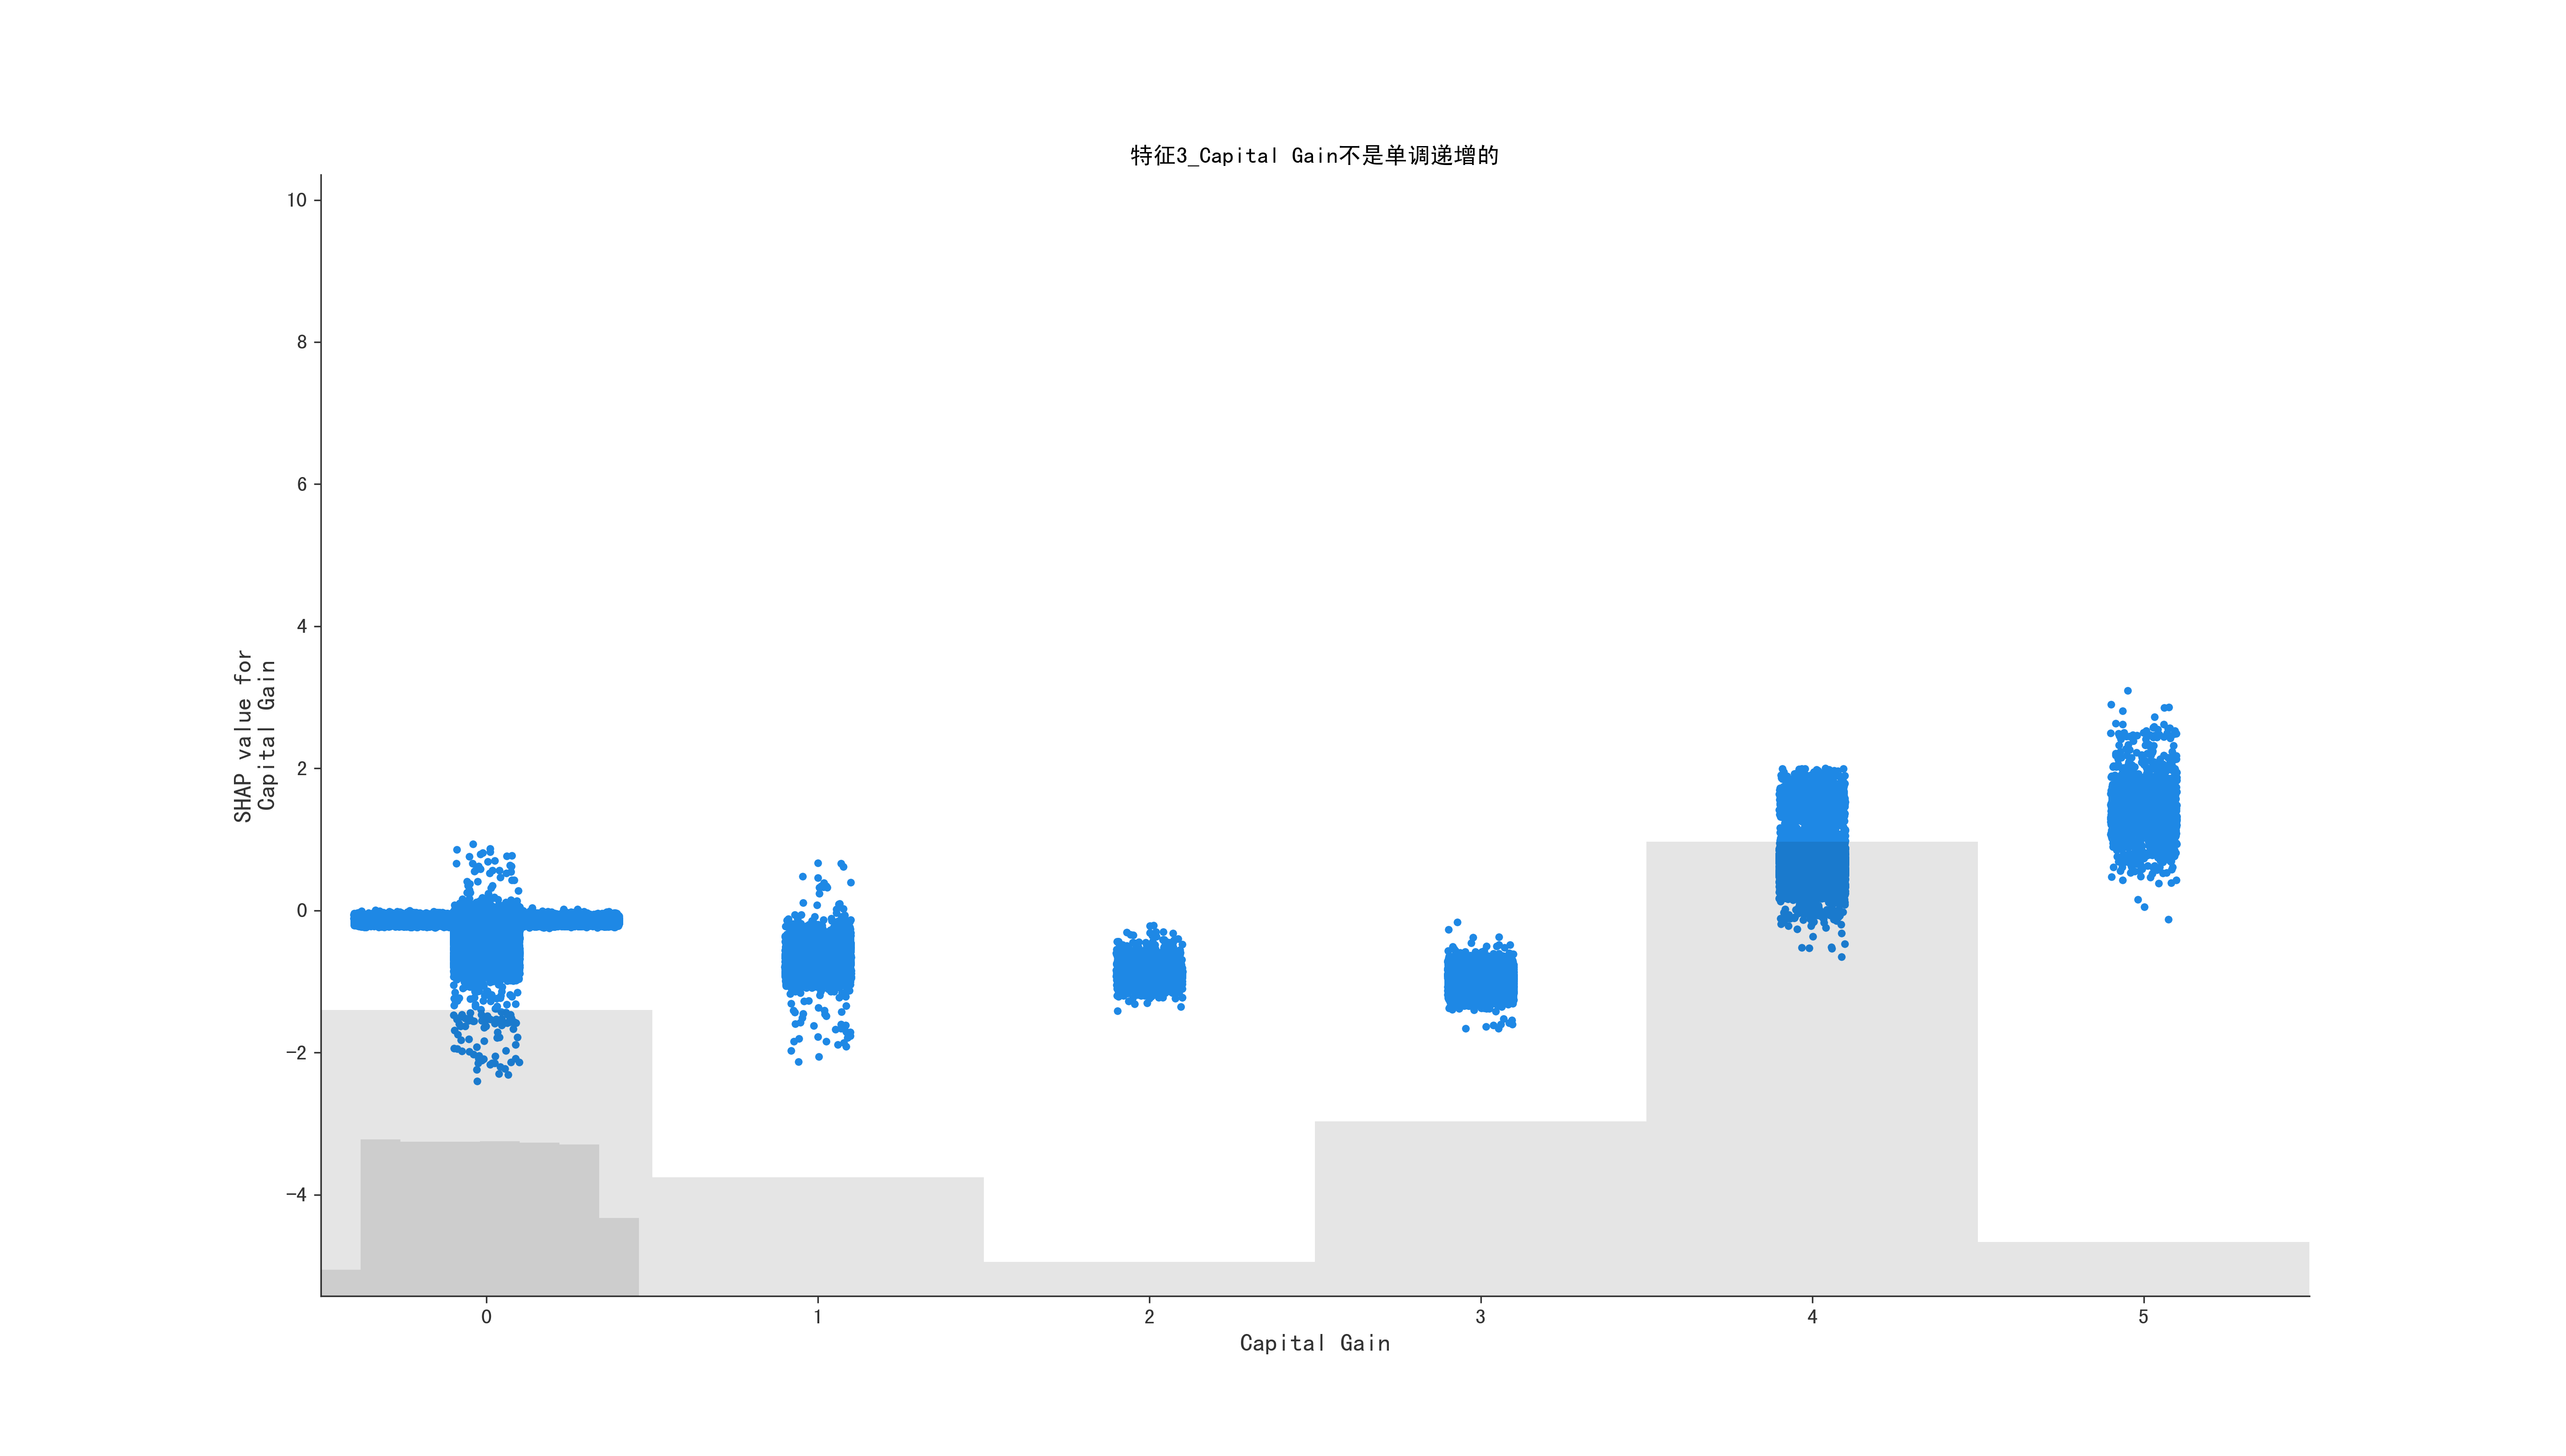
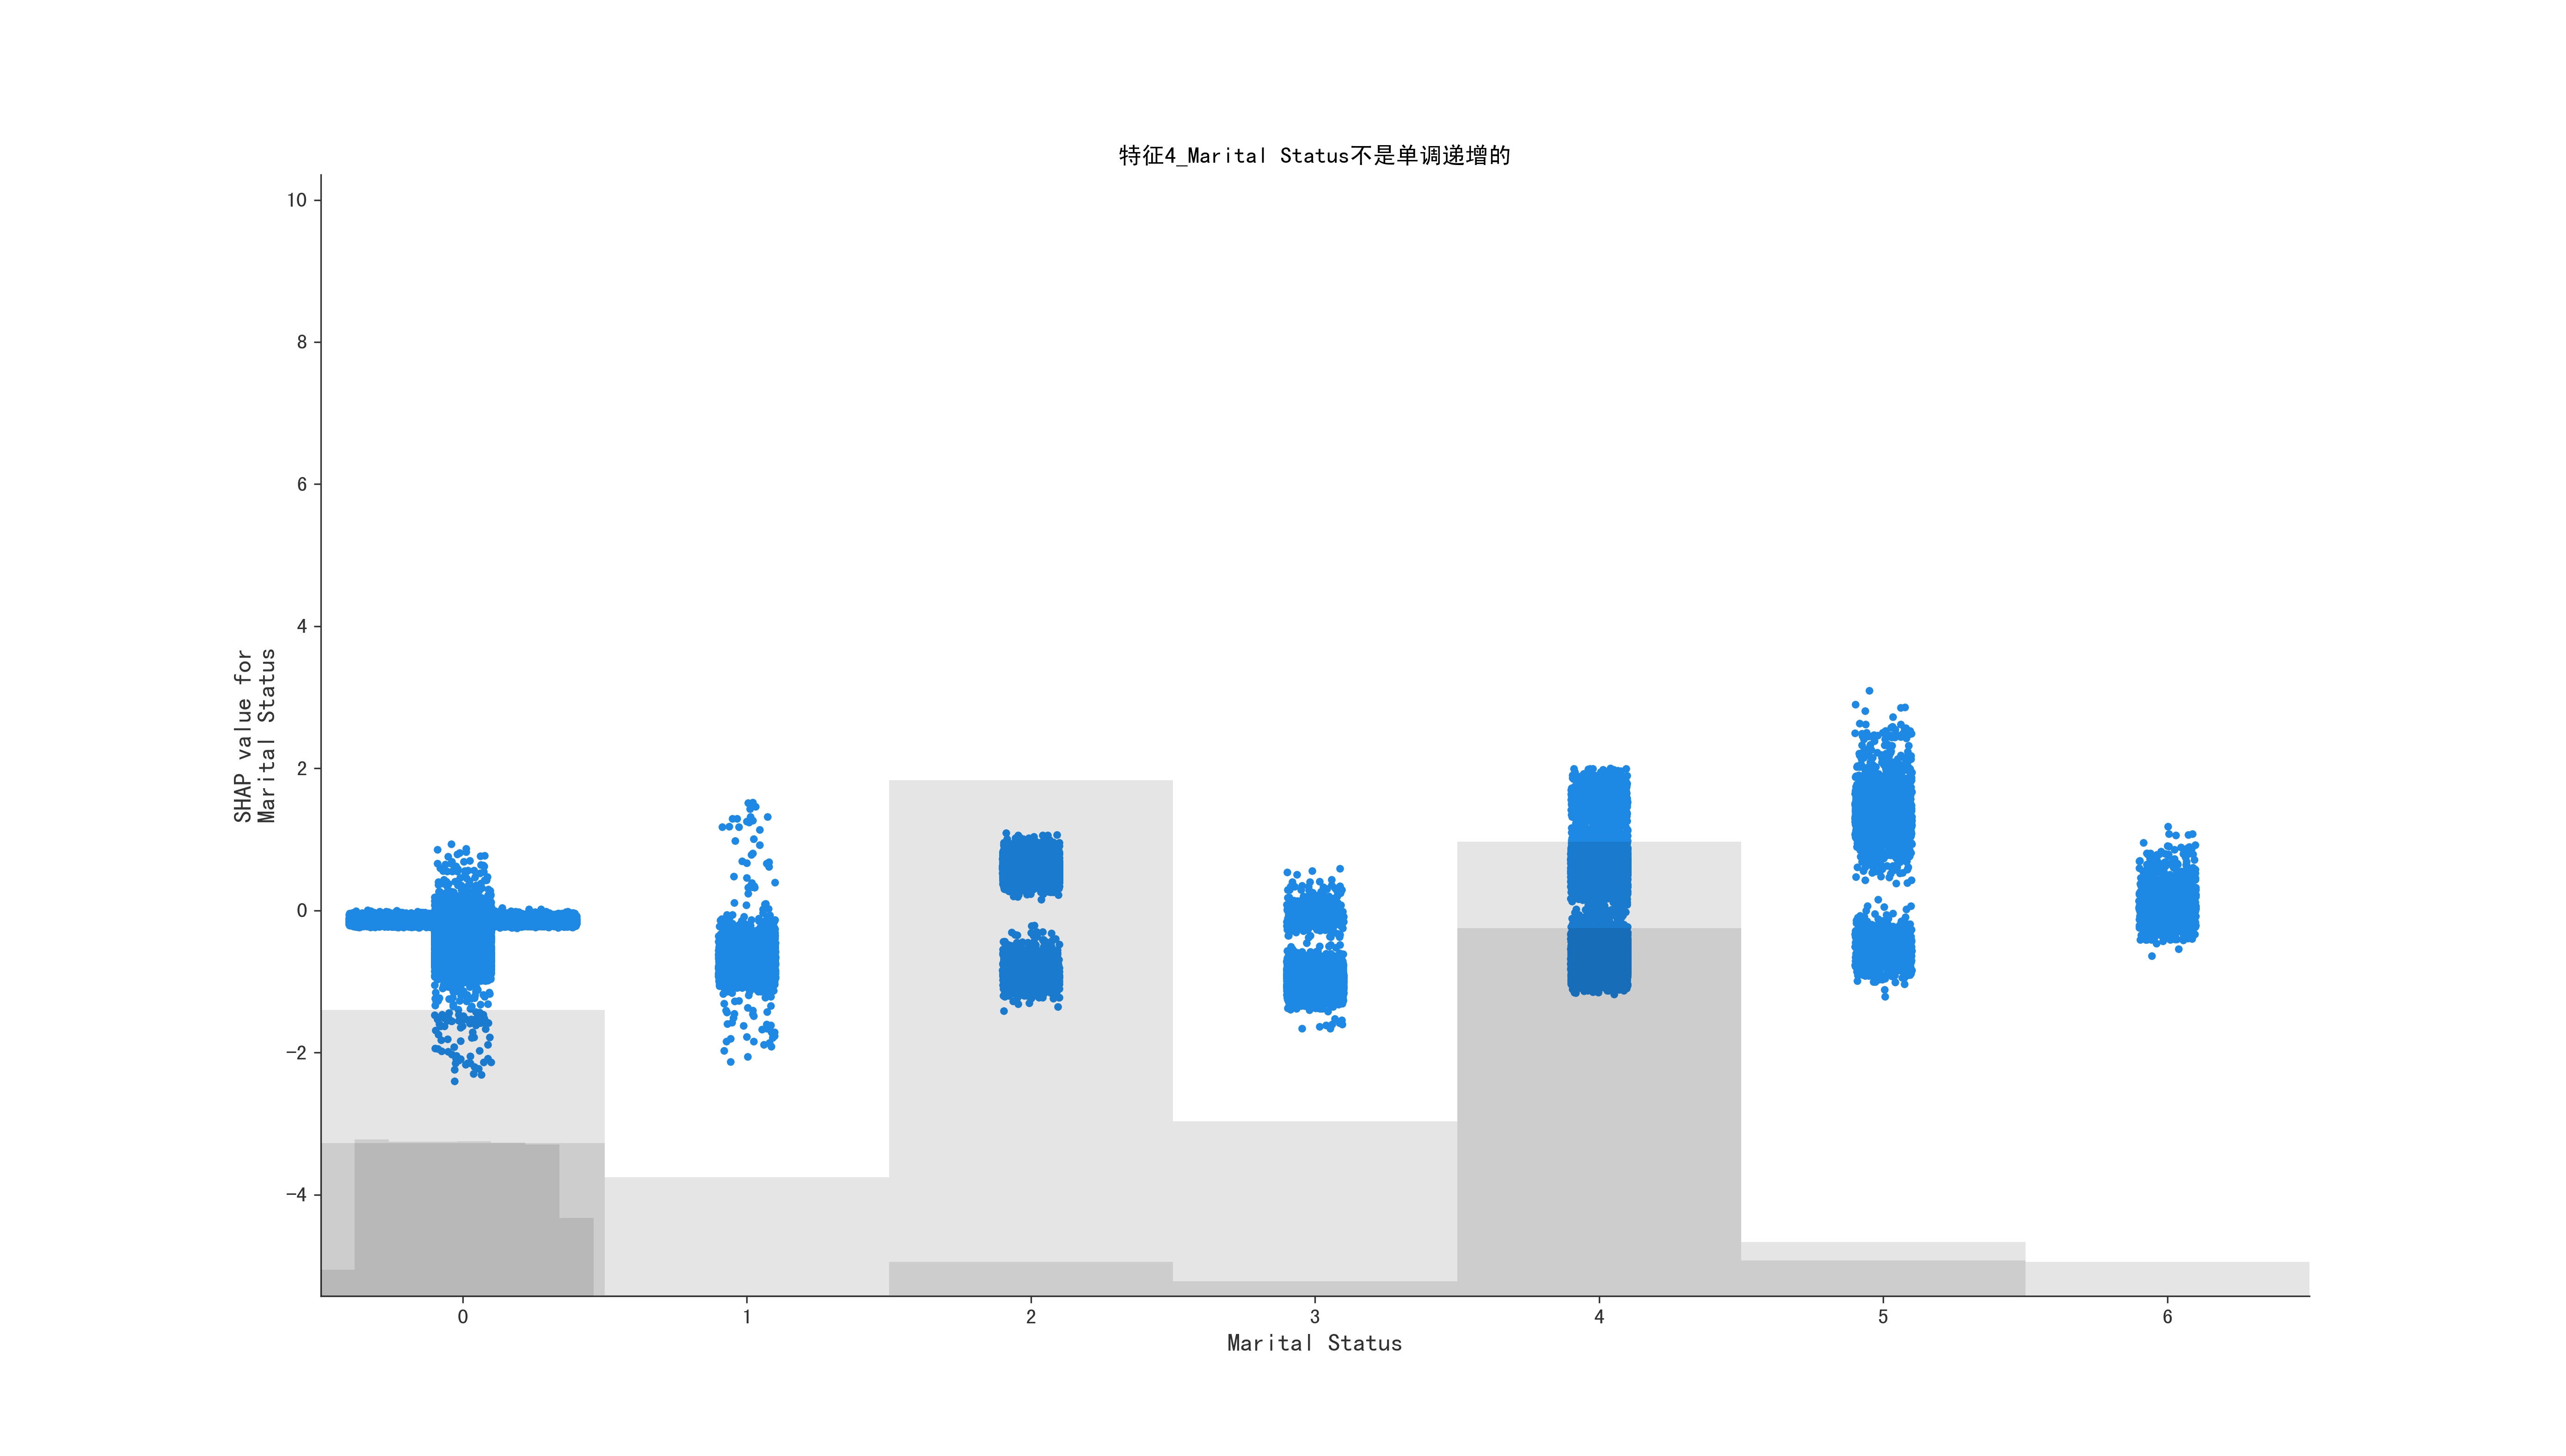
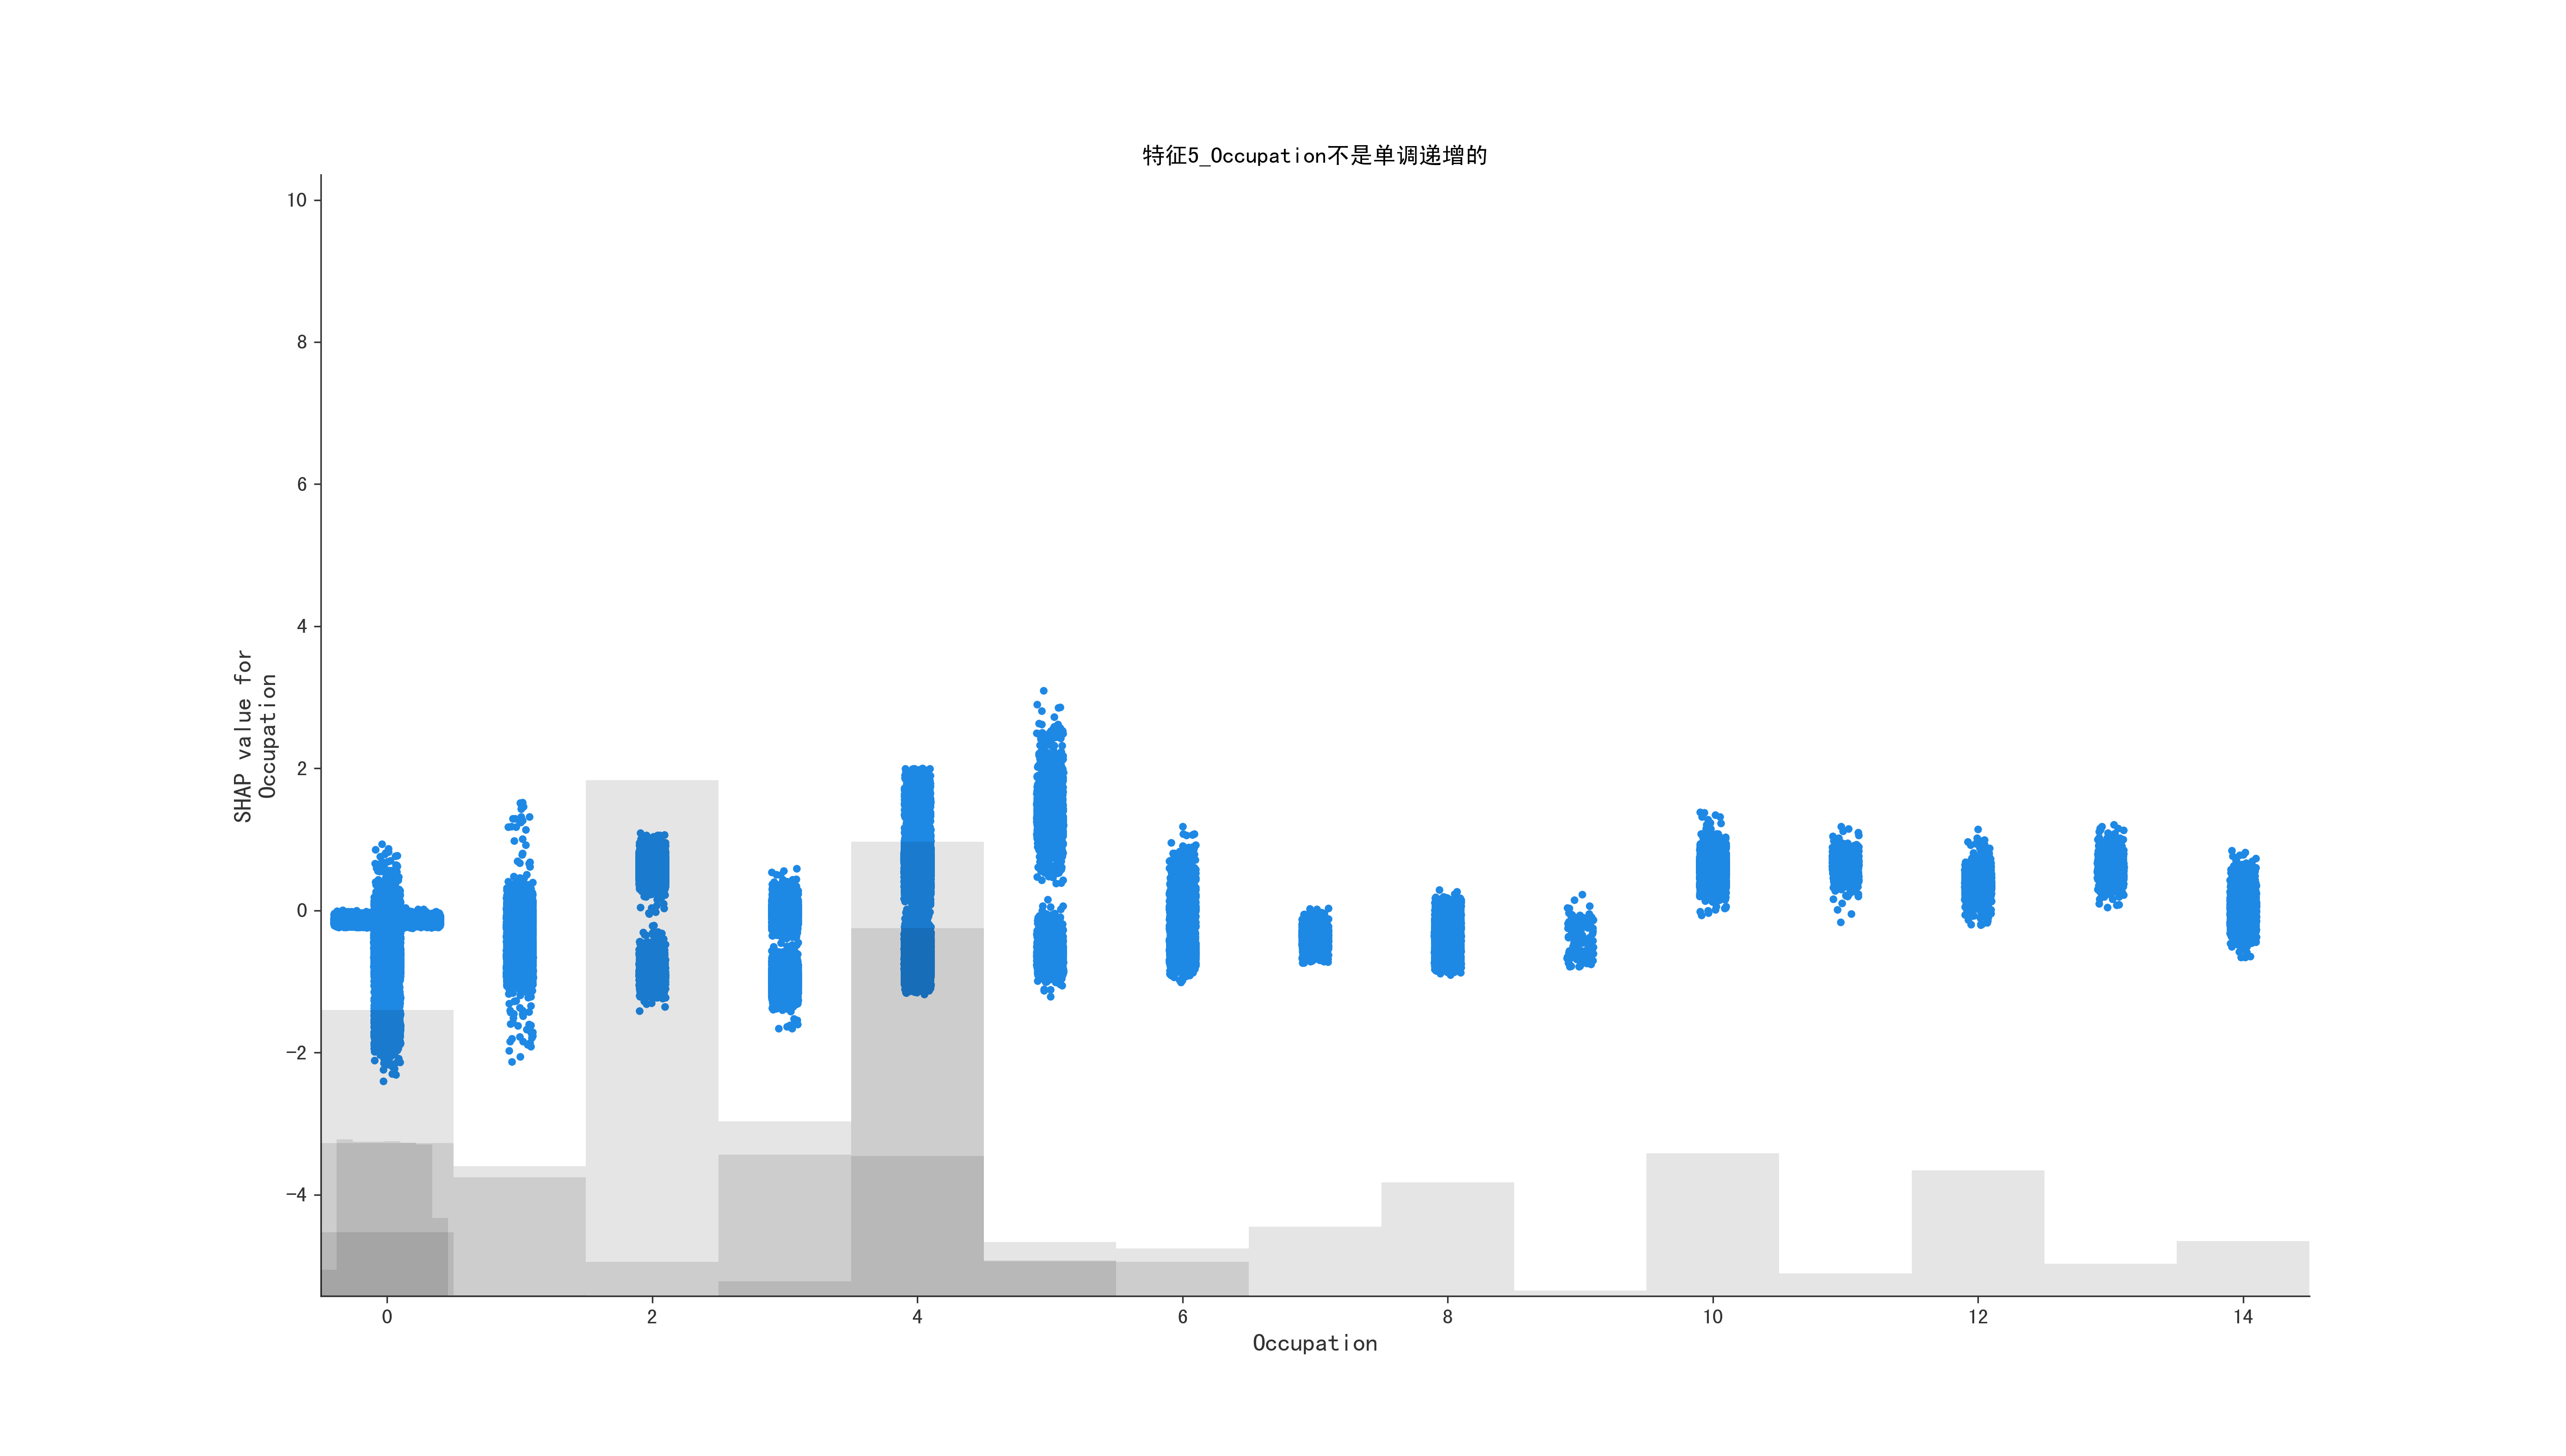
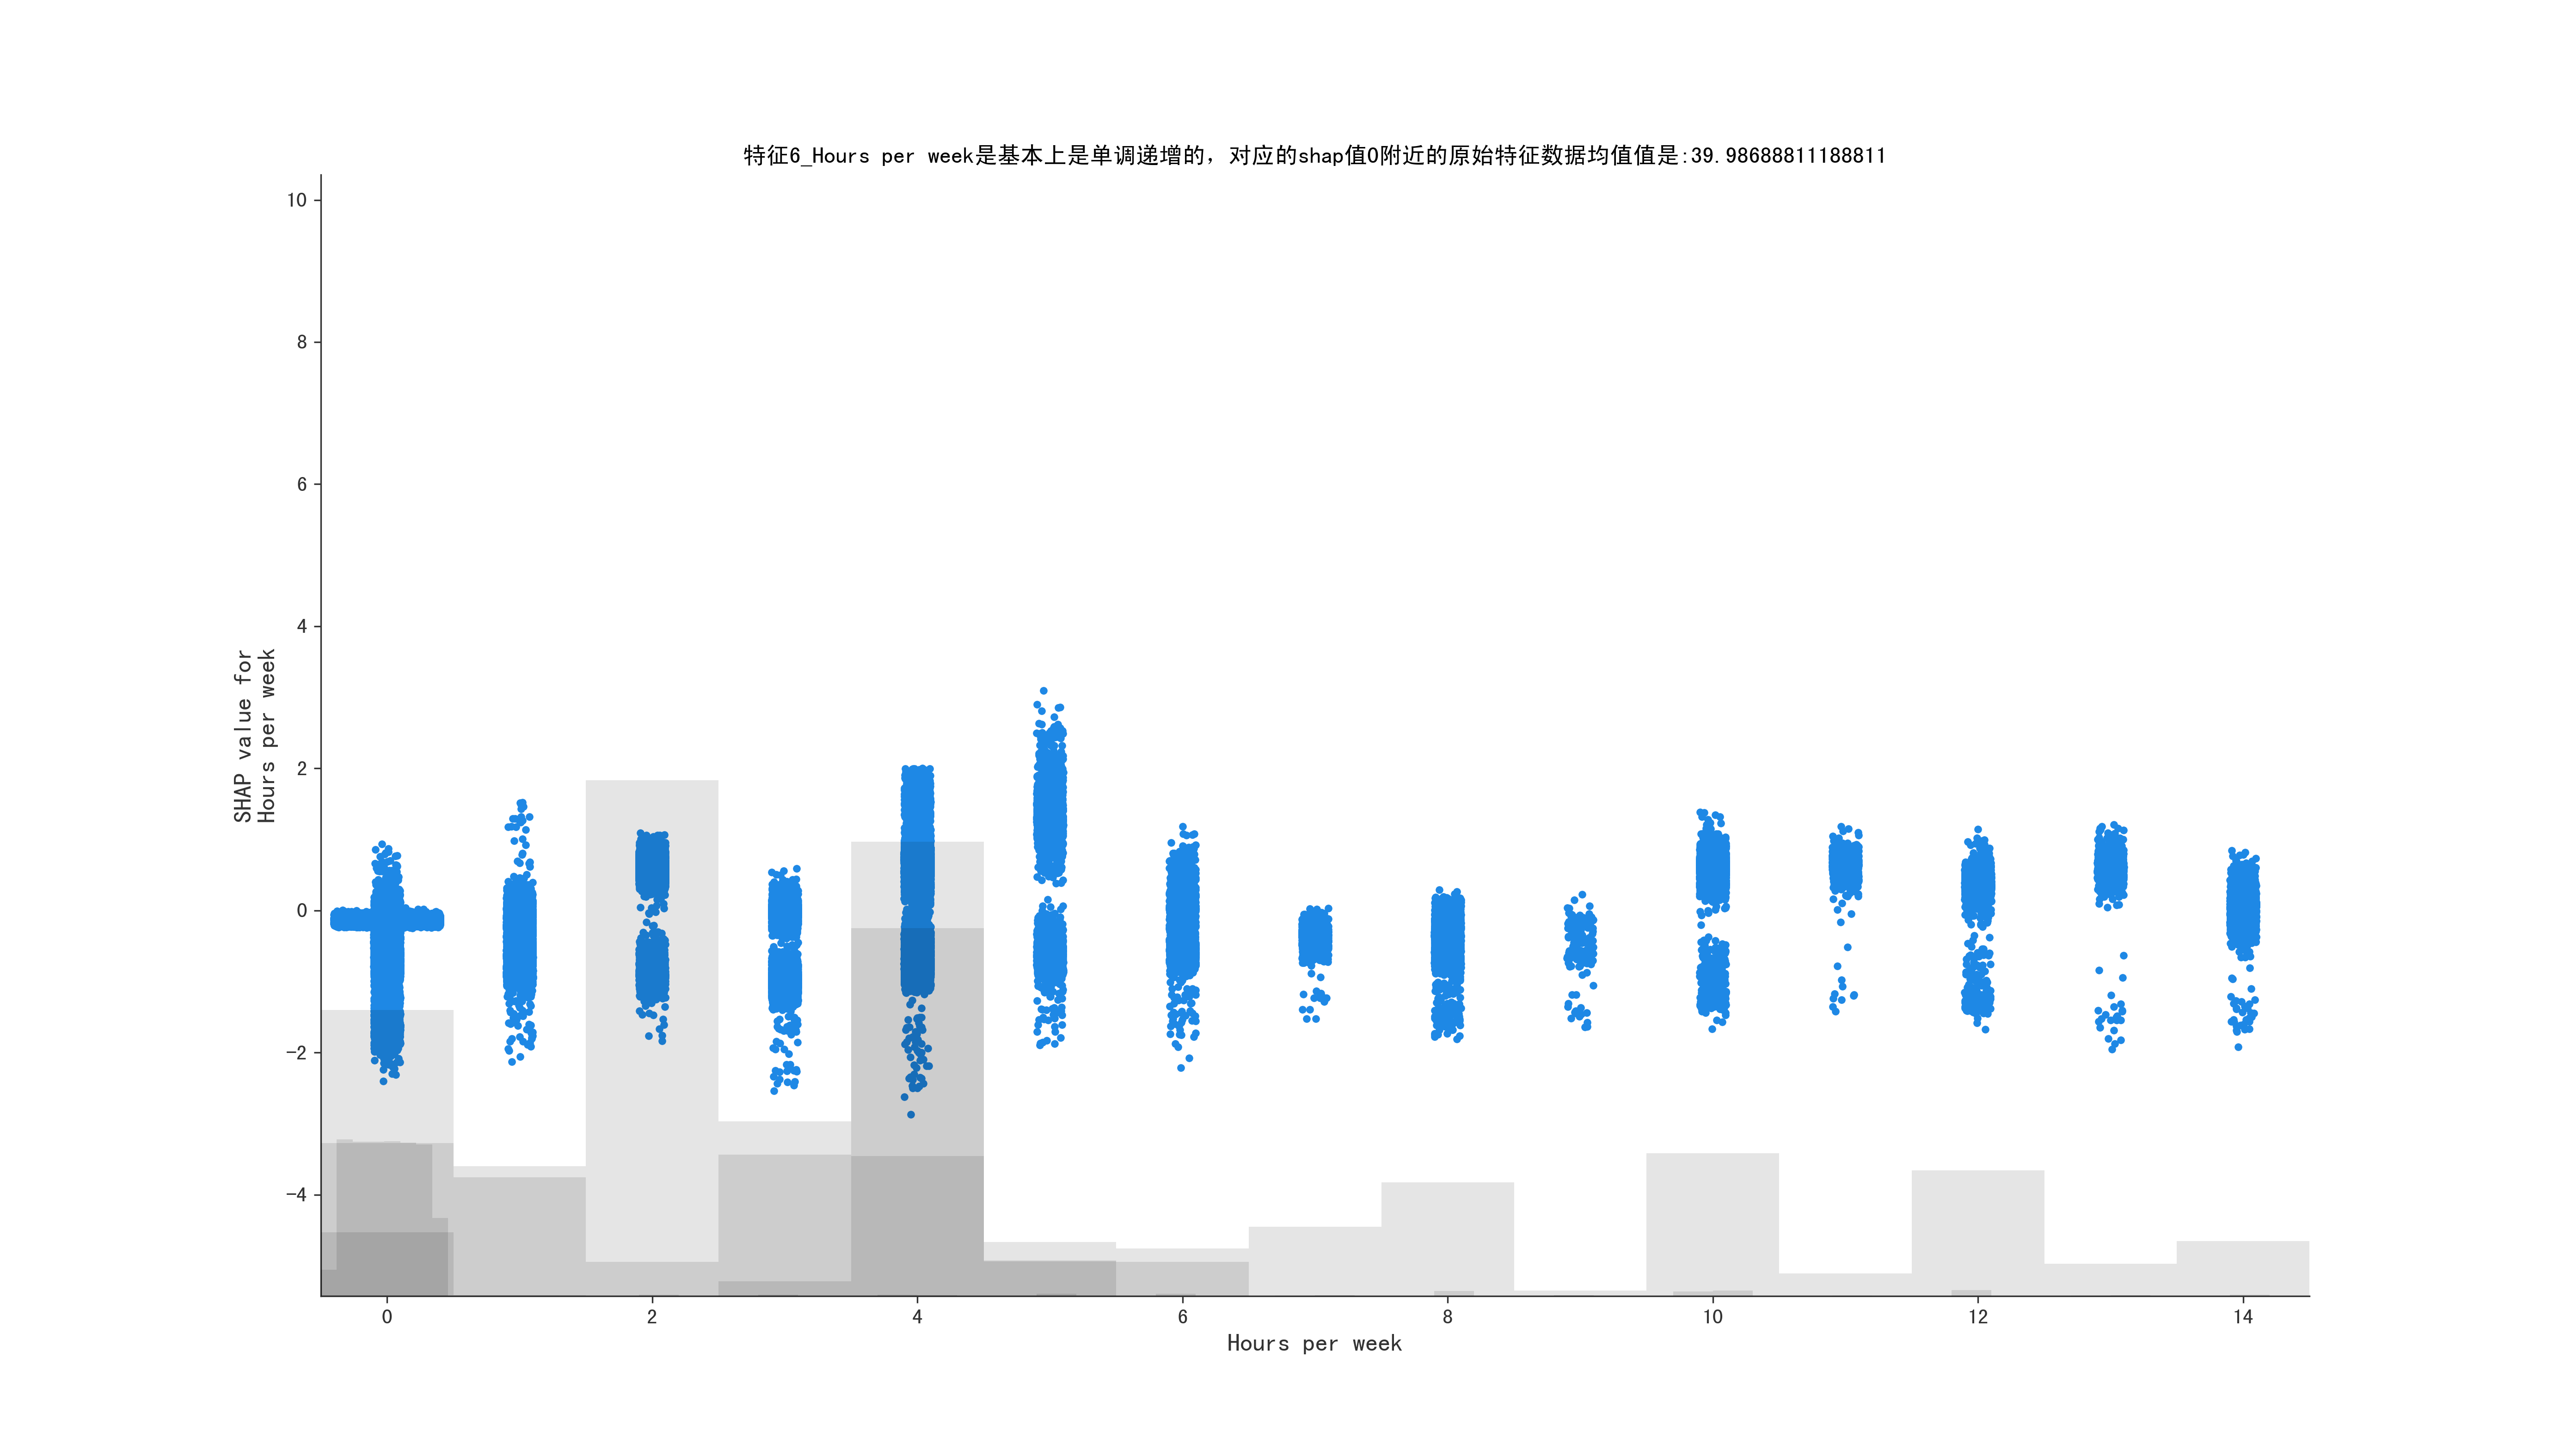
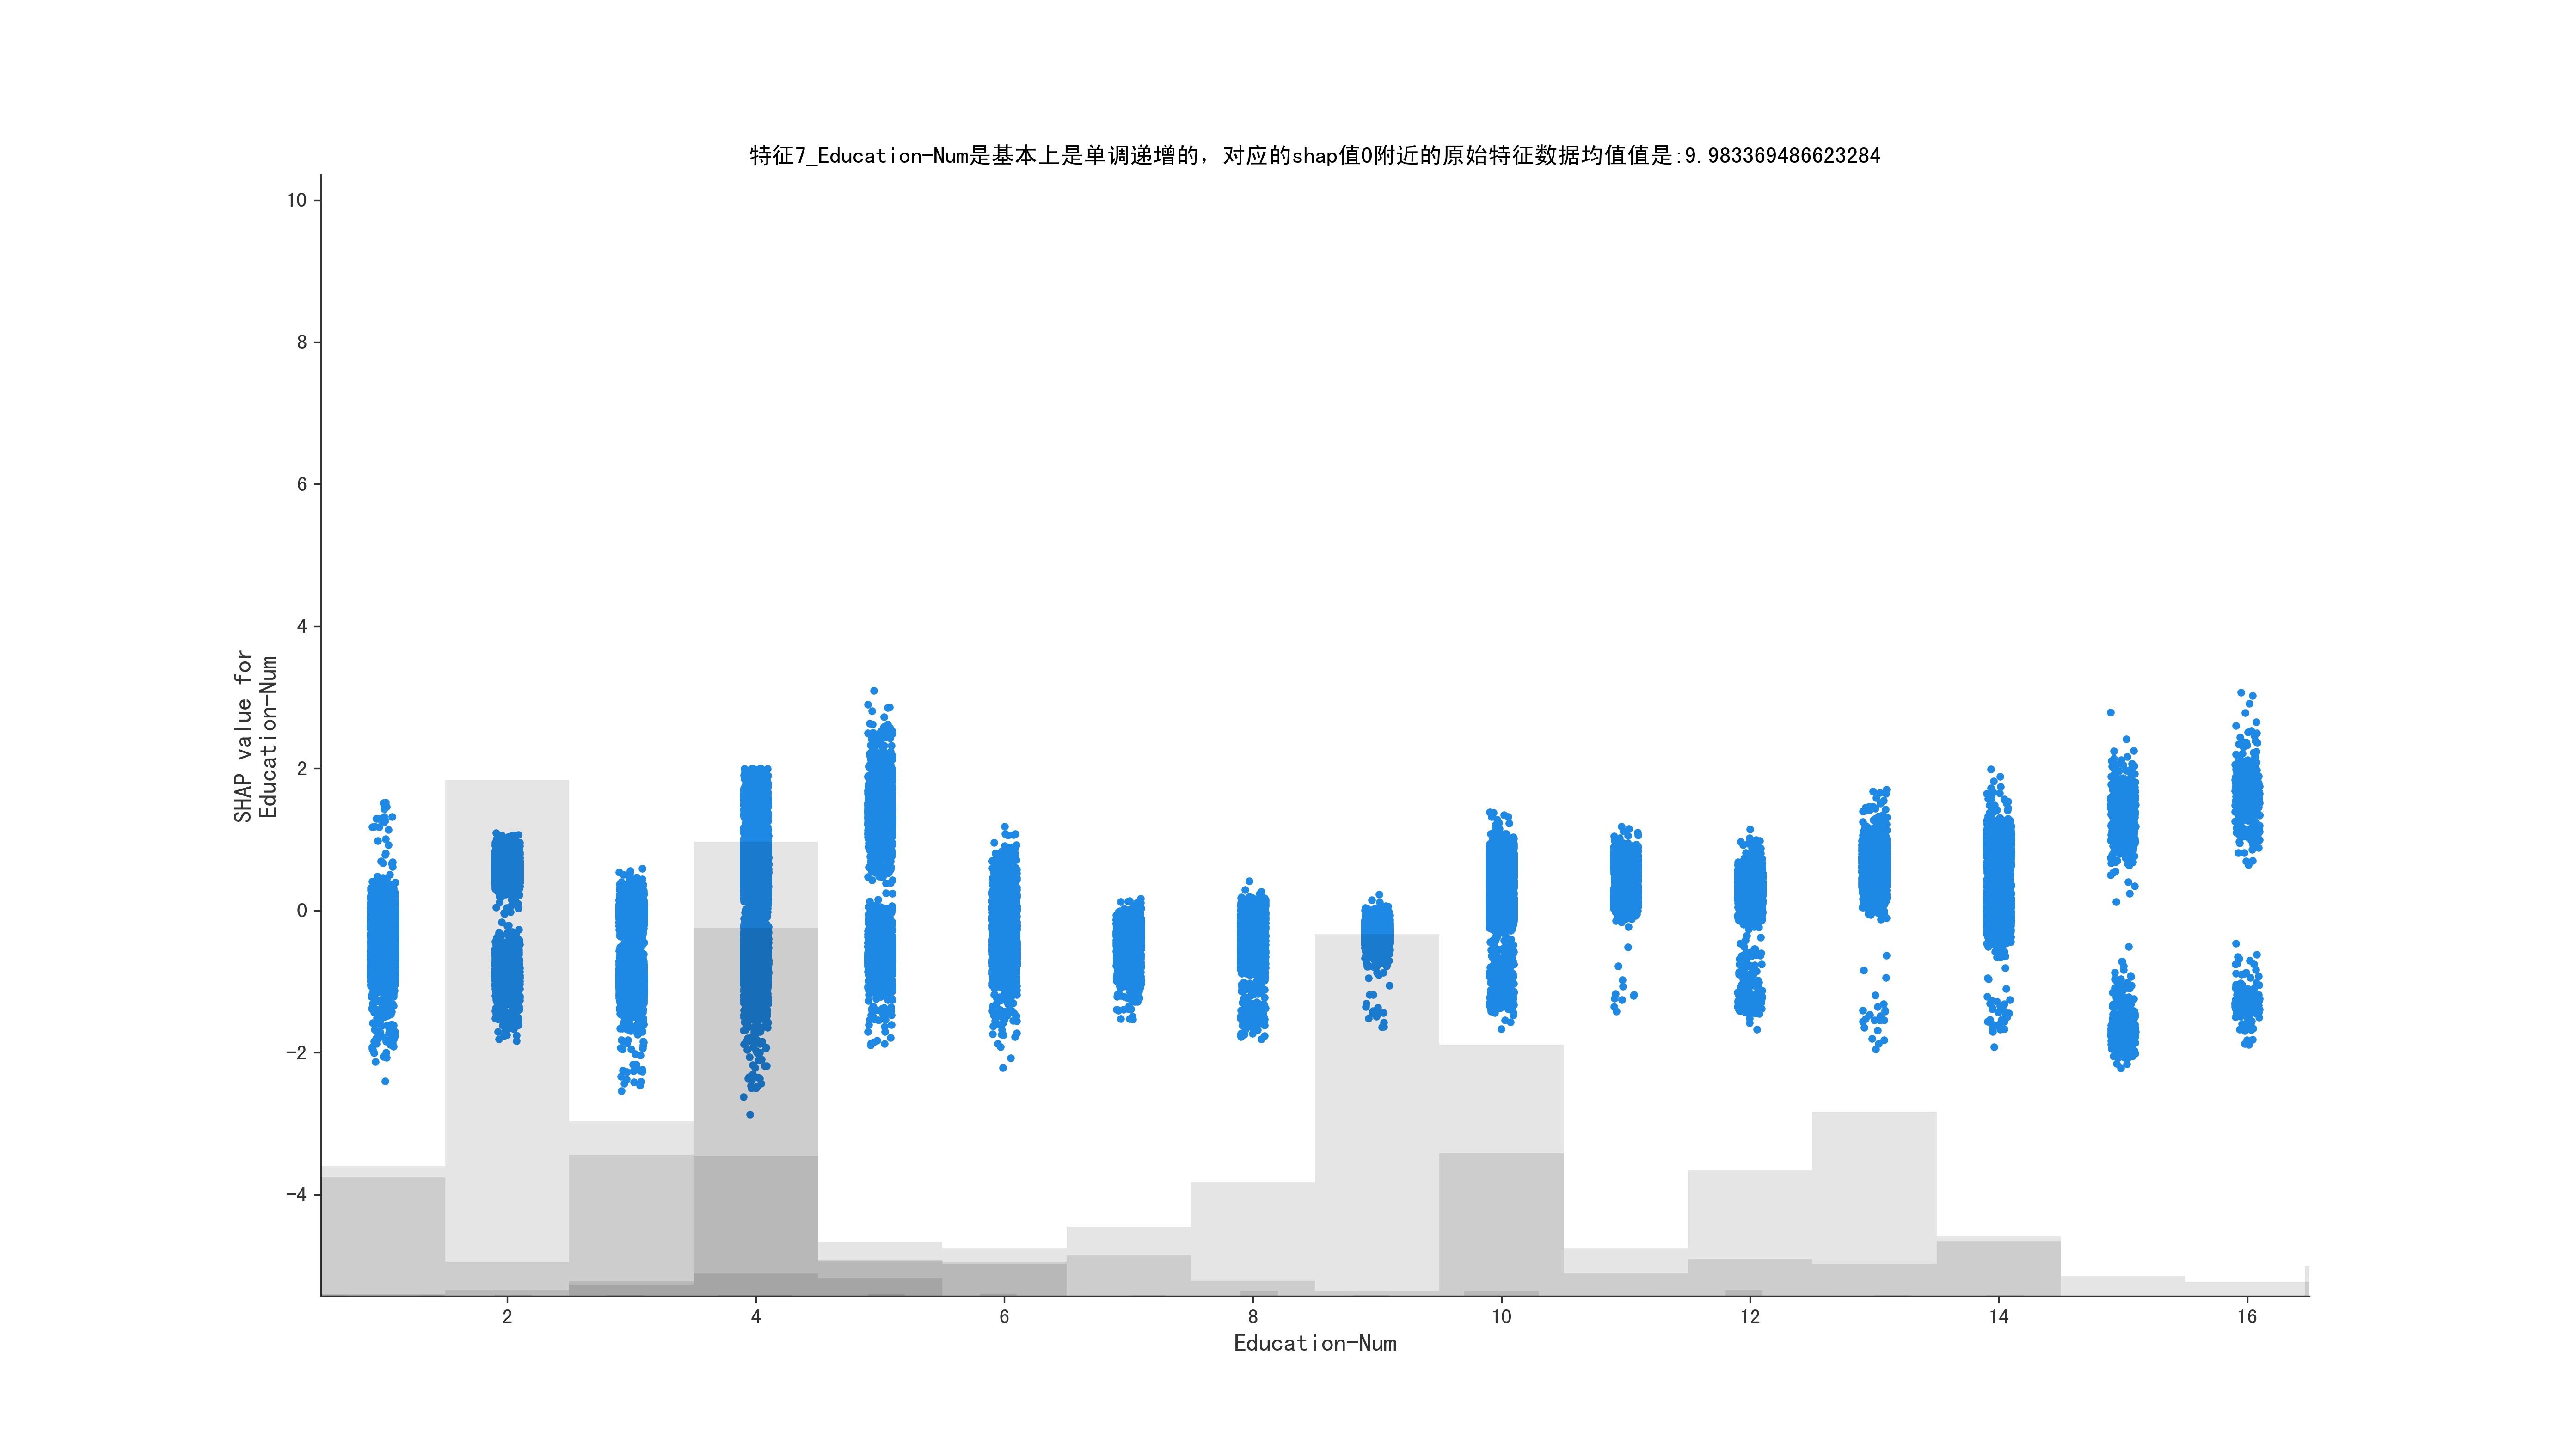
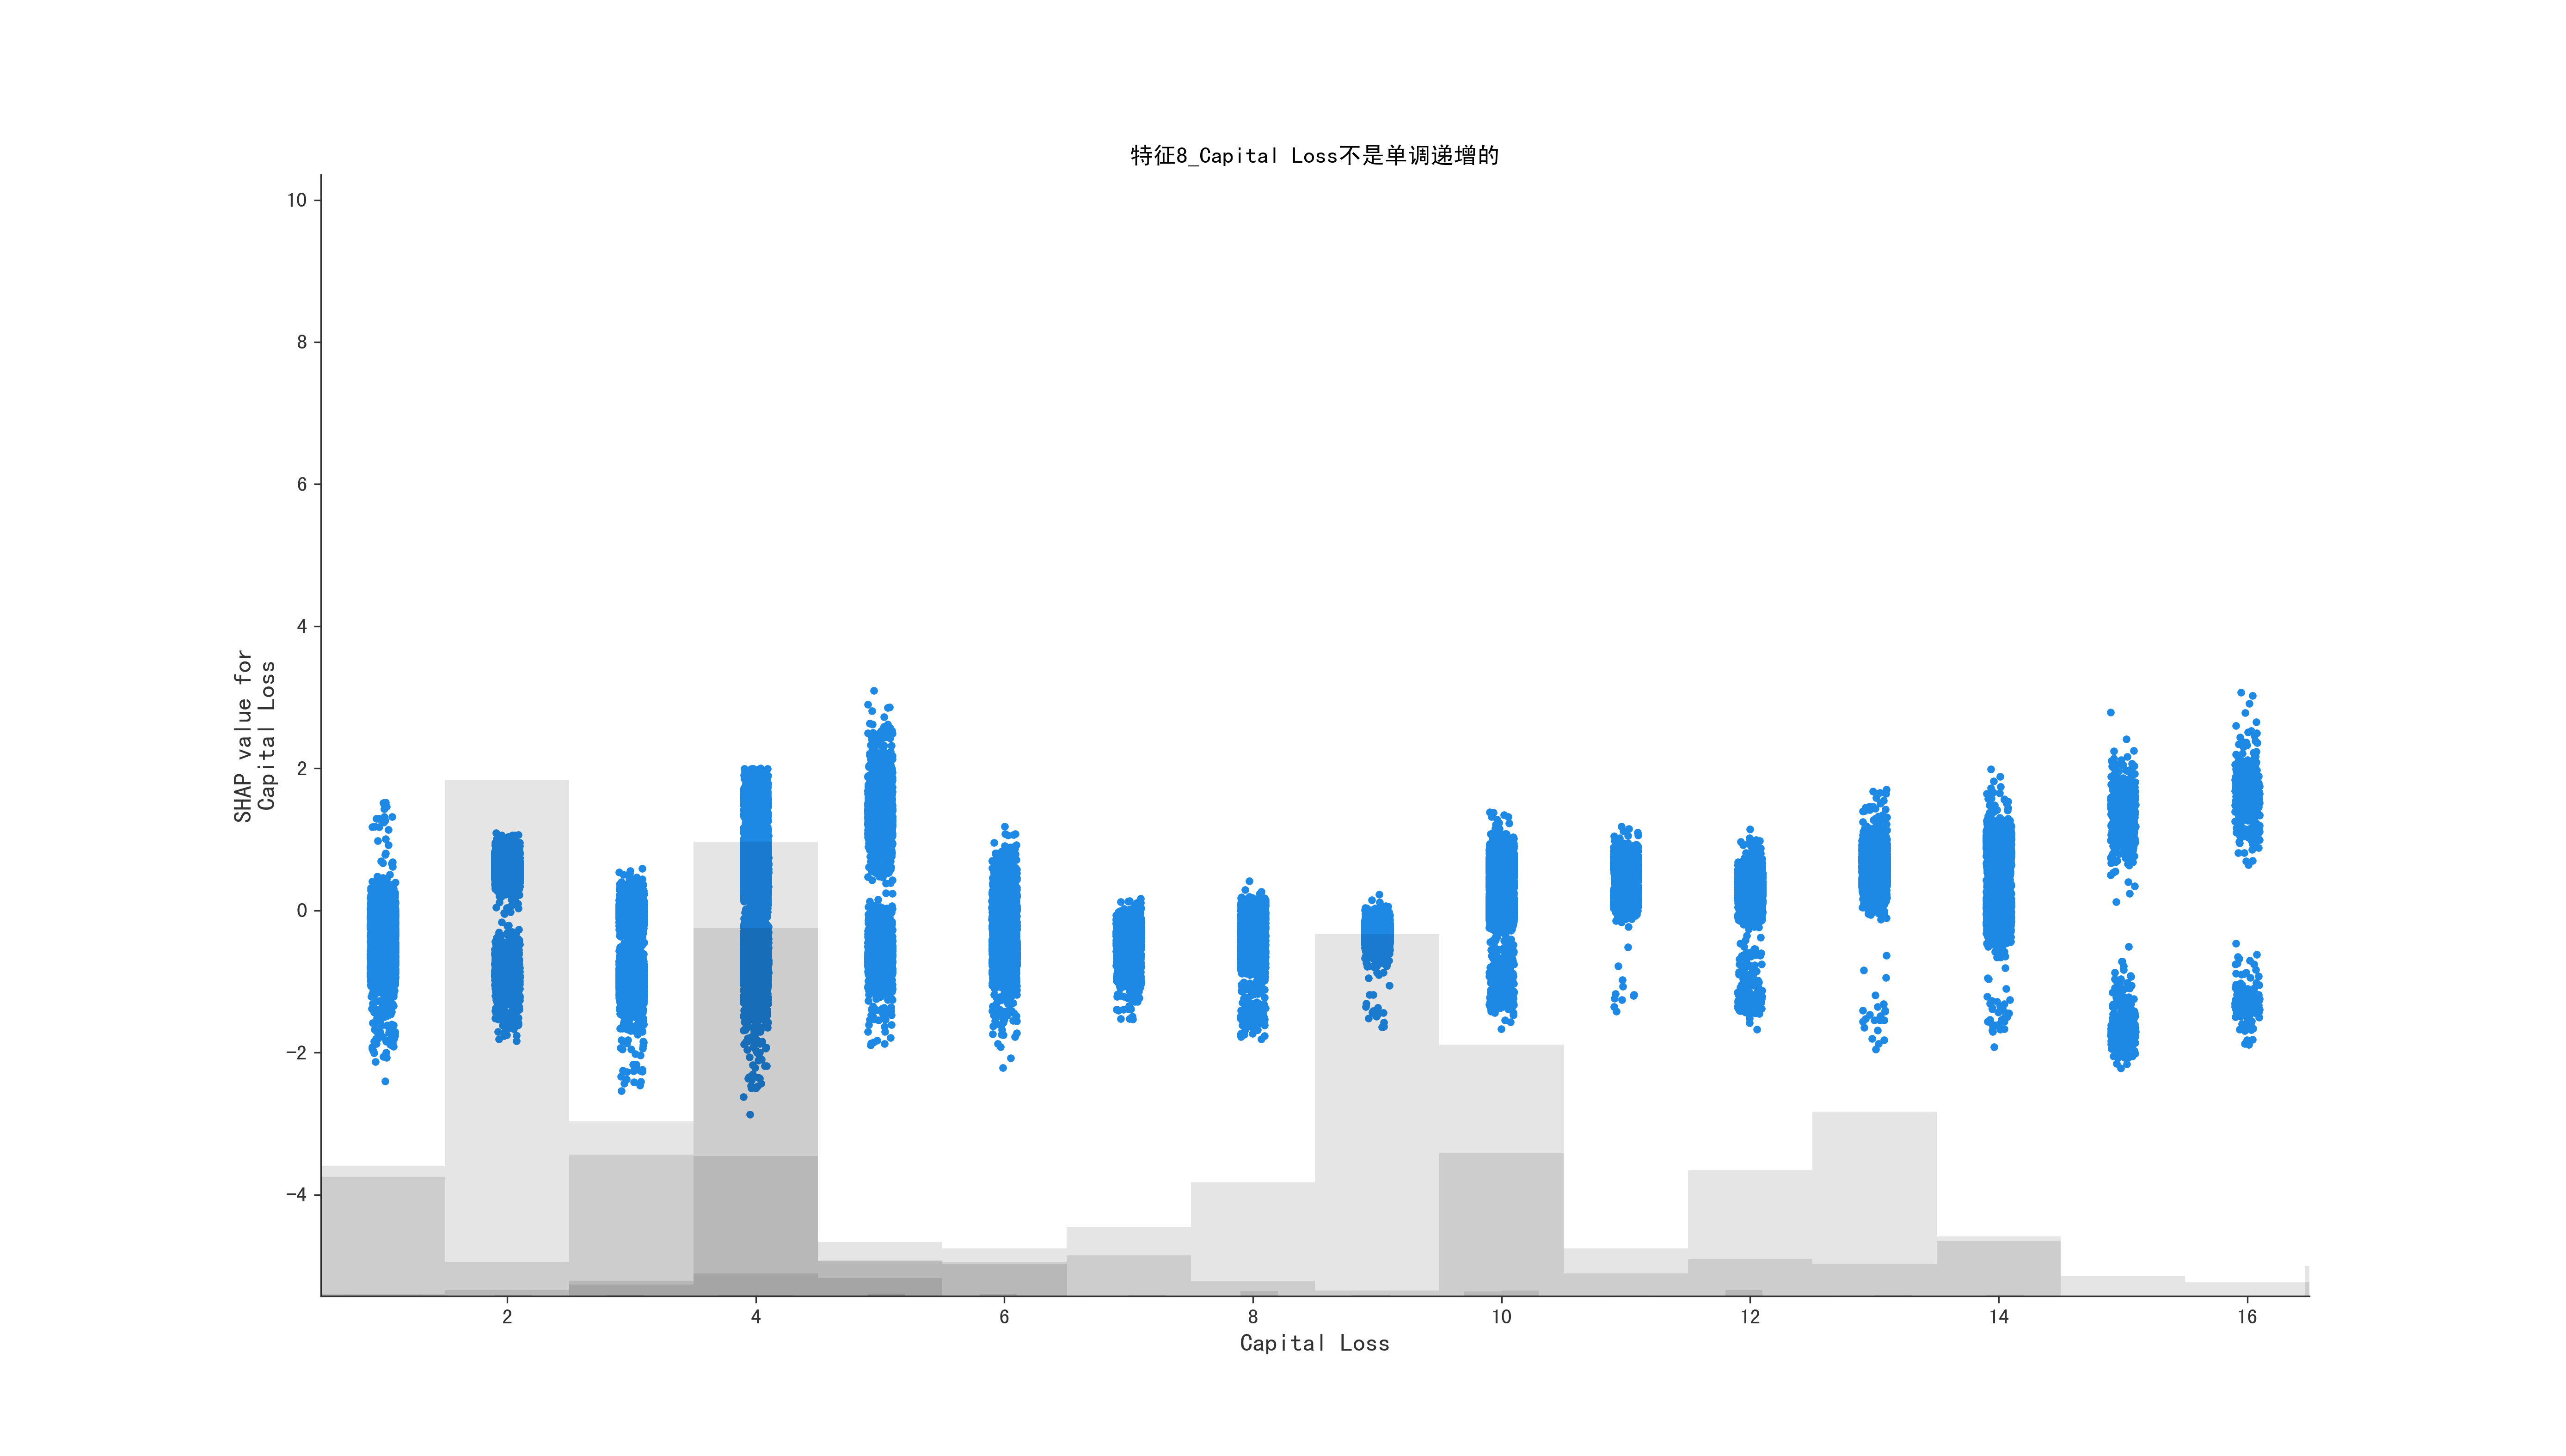
for i in range(1, 10, 1):
mean_shape = shap_values[:, shap_values.abs.mean(0).argsort[-i]]
is_monotone, middle_data, feature_name = get_middle_data(mean_shape)
fig = plt.gcf()
fig.set_size_inches(18.5, 10.5, forward=True)
ax = fig.gca()
if is_monotone:
title = f"特征{i}_{feature_name}是基本上是单调递增的,对应的shap值0附近的原始特征数据均值值是:{middle_data}"
else:
title = f"特征{i}_{feature_name}不是单调递增的"
ax.set_title(title)
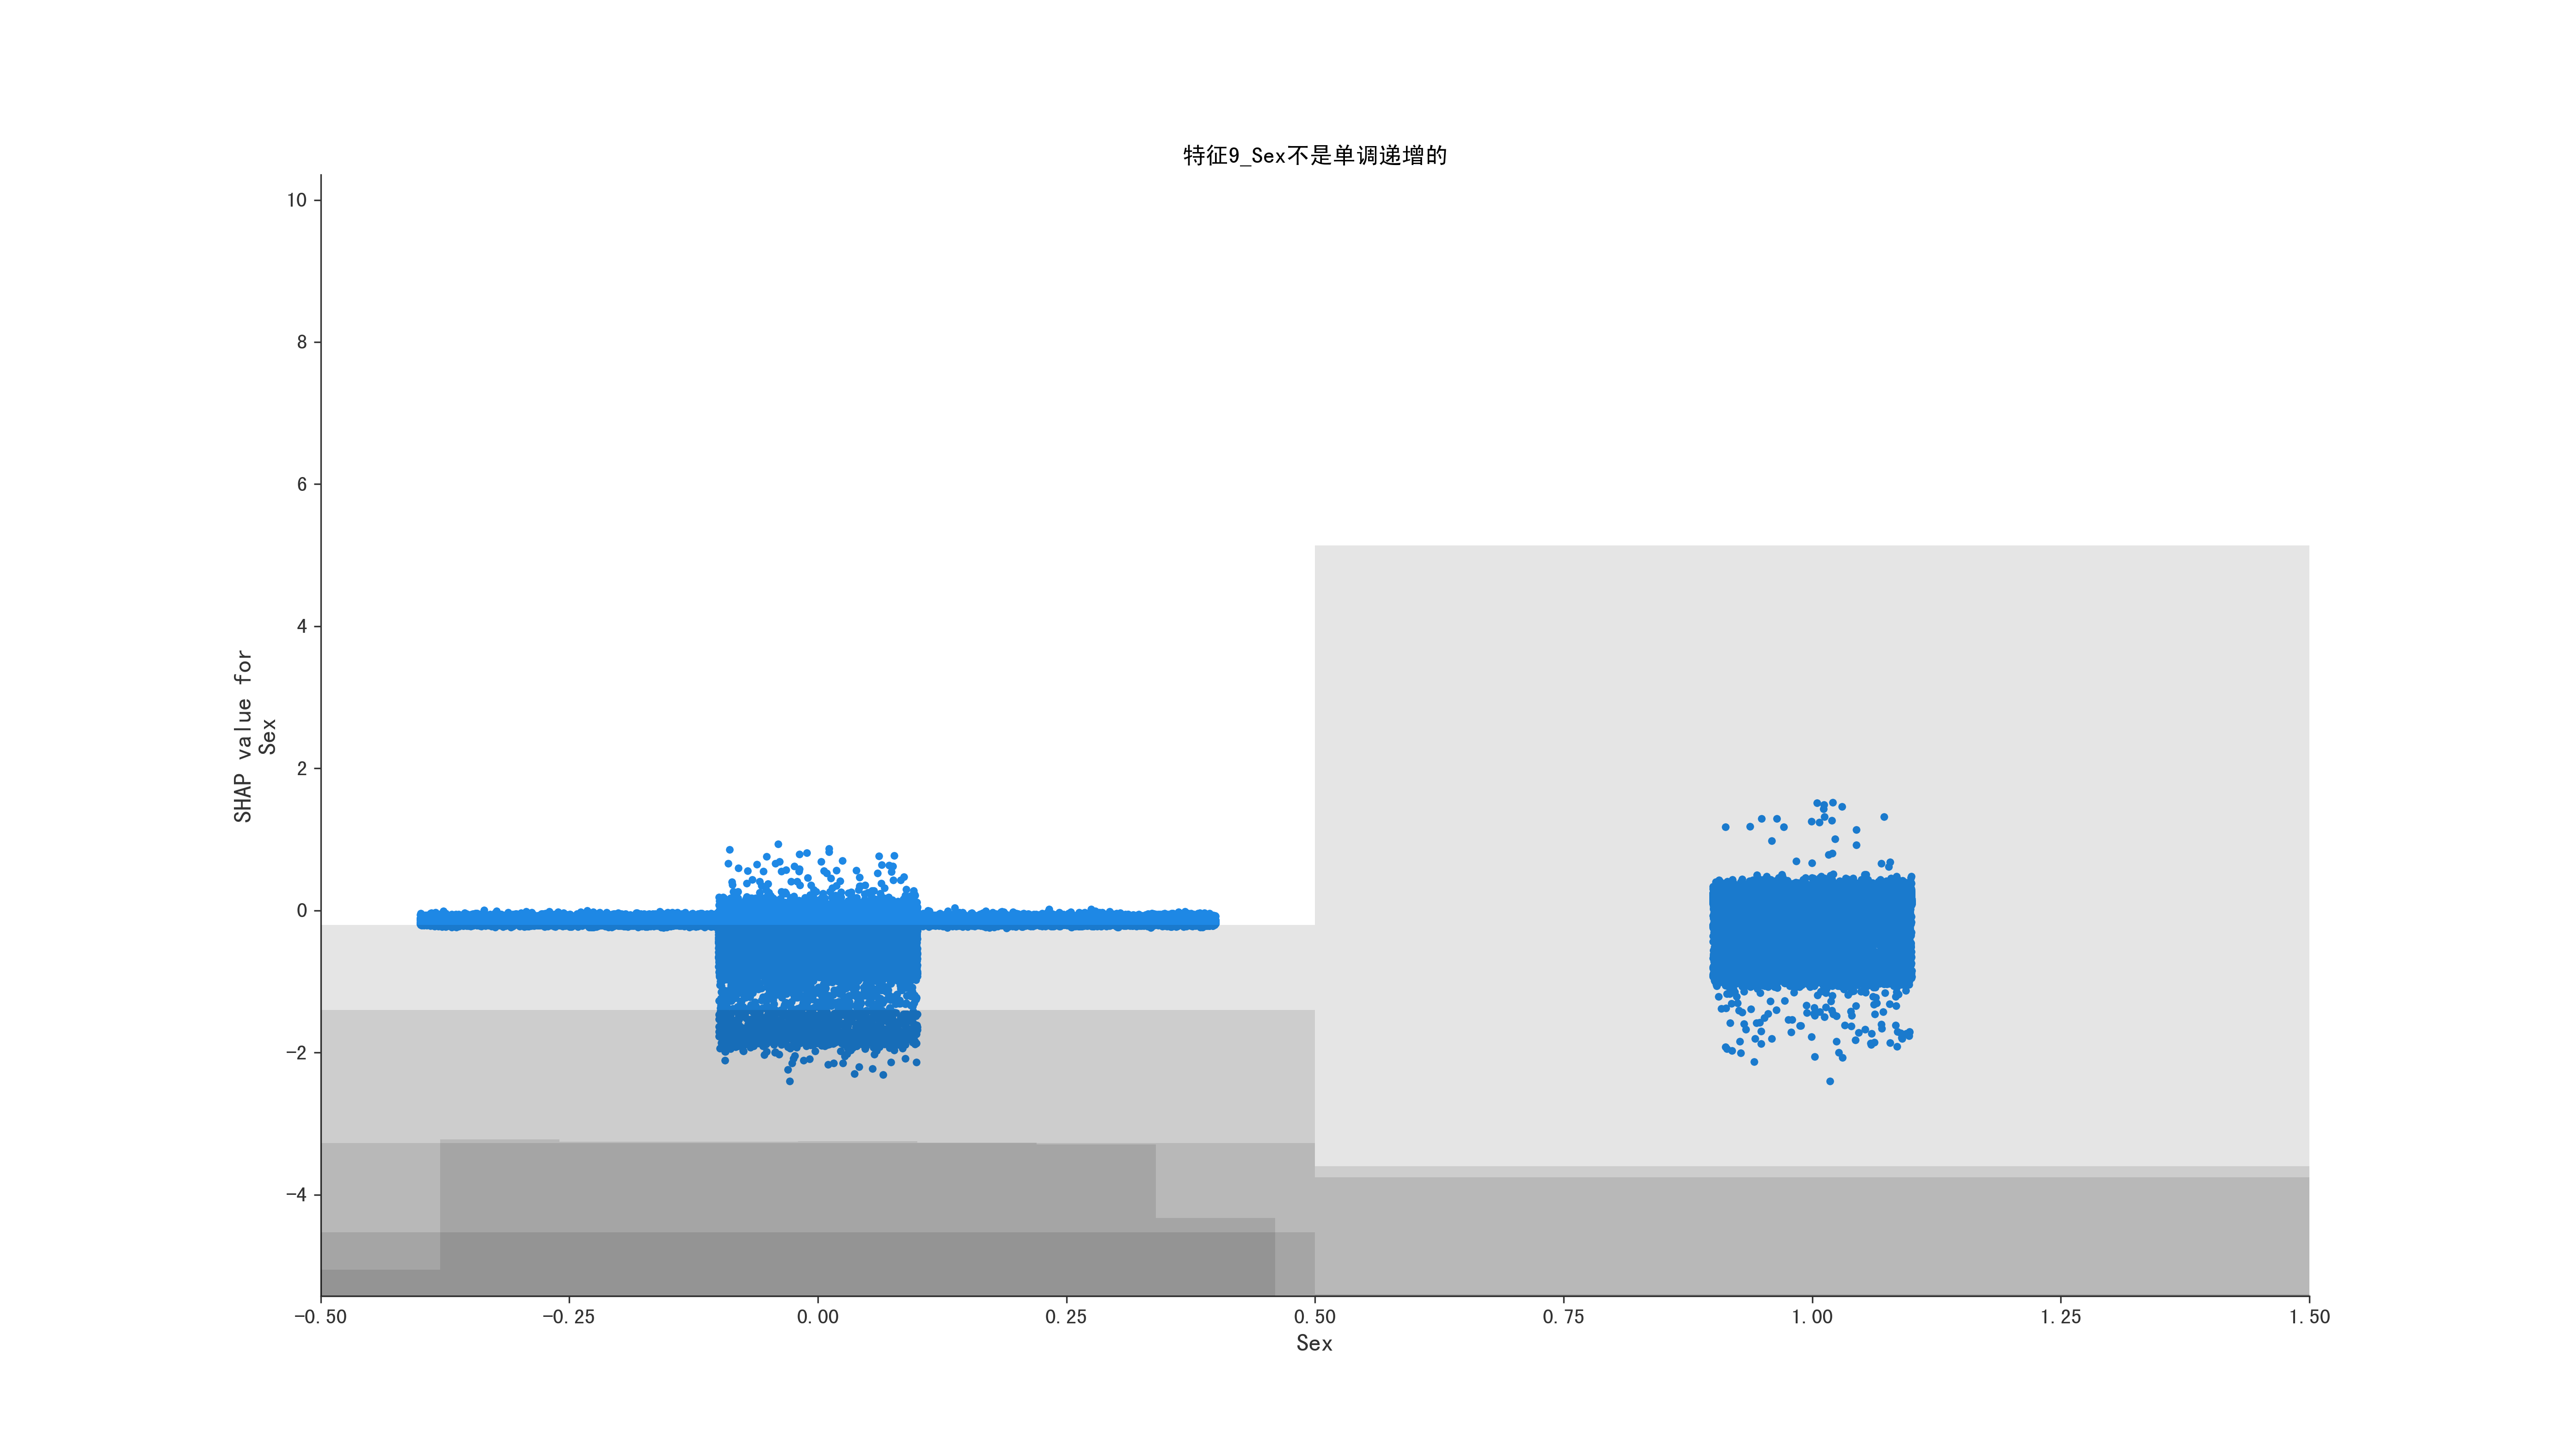
shap.plots.scatter(shap_values = mean_shape, ax=ax)
|
